1. Introduction
In today’s cloud-native ecosystem, Prometheus monitoring Kubernetes is the leading platform for orchestrating containers. Efficient cluster management demands a reliable monitoring solution. Prometheus monitoring Kubernetes, an open-source system, has become a popular choice for observing Kubernetes environments due to its scalability and powerful query language. By leveraging this monitoring tool, organizations gain real-time visibility into cluster health, resource utilization, and performance metrics.
2. Why Prometheus is Perfect for Kubernetes Monitoring
Prometheus monitoring Kubernetes workloads are highly dynamic — pods scale in and out, nodes frequently join or leave, and service IPs change regularly. The monitoring system is designed to efficiently handle these scenarios, making it perfect for container orchestration platforms.
Key benefits include:
-
Automatic Target Discovery: Dynamically detects new pods, nodes, and services without manual setup.
-
Rich Labeling: Metrics are enriched with Kubernetes metadata such as namespaces, pod names, and container identifiers.
-
Granular Insights: Provides node-level, pod-level, and container-level monitoring.
-
Custom Metrics Support: Applications can expose business-specific metrics using client libraries.
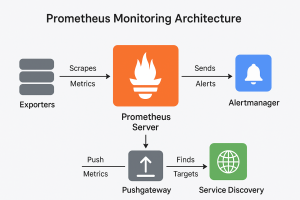
3. Architecture Prometheus monitoring Kubernetes
The architecture consists of several components:
-
Server: Core component scraping metrics and storing them in a time-series database.
-
Node Exporter: Collects OS and hardware statistics from each node.
-
Kube-State-Metrics: Provides detailed info on Kubernetes objects like Deployments and StatefulSets.
-
cAdvisor: Gathers container-level resource usage metrics such as CPU and memory.
-
Alertmanager: Handles alerts based on predefined rules.
-
Grafana: Visualizes metrics through dashboards for easy analysis.
4. Installing Prometheus monitoring Kubernetes
There are multiple installation options:
-
Using Helm charts (recommended)
-
Deploying via Kubernetes Operator
-
Manual deployment with YAML manifests
Example with Helm:
This installs Prometheus server, Alertmanager, Grafana, and required exporters.
Access Prometheus UI with:
5. Collecting Metrics Prometheus monitoring Kubernetes
The monitoring system gathers data from:
-
Kube-State-Metrics: Reflects the state of Kubernetes resources.
-
Node Exporter: Provides node-level hardware and OS metrics.
-
cAdvisor: Collects container CPU, memory, and storage usage.
-
Custom Application Metrics: Business KPIs exposed by apps.
Sample PromQL query:
This shows CPU usage per pod in the default namespace.
6. Visualizing Metrics with Grafana
To create dashboards:
-
Install Grafana in your cluster.
-
Add Prometheus as a data source.
-
Import Kubernetes-specific dashboards from Grafana.com (e.g., dashboard ID 6417).
-
Customize dashboards as needed for your environment.
7. Best Practices Prometheus monitoring Kubernetes
-
Use consistent labels to simplify filtering and grouping metrics.
-
Avoid high cardinality to maintain performance.
-
Configure data retention periods (e.g., 15 days) to manage storage.
-
Set alerts for critical events like CPU spikes, memory saturation, and pod restarts.
-
Secure monitoring endpoints with authentication and network policies
8. Scaling for Large Cluster
Challenges include high memory use and long-term storage needs.
Solutions:
-
Use projects like Thanos or Cortex for horizontal scaling and multi-year storage.
-
Reduce scrape frequency for less critical workloads.
-
Drop unneeded metrics during scraping to save resources.
9. Advantages
-
CNCF-backed with a strong community.
-
Seamless Kubernetes integration.
-
Supports a wide variety of exporters.
-
Flexible querying with PromQL.
-
Powerful alerting and visualization capabilities.
10. Limitations
-
Scalability requires additional components.
-
No built-in long-term storage.
-
Can face issues with extremely high-cardinality metrics.
11. Conclusion
Overall, using Prometheus for Kubernetes cluster observability is essential for modern containerized deployments. Its scalability, flexibility, and alerting features make it the preferred monitoring solution for Kubernetes users worldwide. With this monitoring approach, organizations achieve better cluster health management, faster troubleshooting, and optimized resource usage.Prometheus has established itself as the go-to monitoring system for Kubernetes due to its robust architecture, dynamic target discovery, and powerful querying language. It provides deep insights into cluster performance and resource utilization, helping teams maintain healthy and efficient Kubernetes environments. Although it has some scalability limitations, integrating it with tools like Thanos or Cortex can overcome these challenges. Overall, Prometheus remains an essential part of modern Kubernetes monitoring strategies, enabling proactive alerting and effective troubleshooting.
“You can also check our guide on Kubernetes Volumes”
https://www.devopsworld.co.in/#
If you have a K8s basics post, link it with: “Learn Kubernetes fundamentals before setting up Prometheus.”