
Introduction
In today’s cloud-native world, Grafana in Kubernetes has become the backbone for managing containerized applications at scale. But operating Kubernetes clusters effectively requires comprehensive monitoring solutions that provide insights into the cluster’s health, resource consumption, and application performance. Grafana in kubernetes is one of the most popular open-source monitoring and visualization platforms used in Kubernetes environments. It helps teams analyze metrics, create insightful dashboards, and set up alerts to proactively manage their clusters.
What is Grafana?
Grafana in kubernetes is an open-source analytics and monitoring platform that enables users to query, visualize, and alert on metrics from multiple data sources, including Prometheus, Elasticsearch, InfluxDB, and more. Unlike monitoring tools that primarily collect metrics, Grafana specializes in visualizing this data in the form of interactive dashboards. This capability makes it an indispensable tool for Kubernetes monitoring, where understanding complex metrics at a glance is vital.

Uses for grafana in kubernetes
-
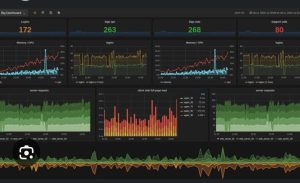
Rich Visualization: Grafana transforms raw metrics into interactive dashboards with graphs, charts, and heatmaps, making data easier to interpret.
-
Seamless Prometheus Integration: Prometheus is the most widely used monitoring tool in Kubernetes. Grafana natively supports Prometheus as a data source, making it easy to visualize Kubernetes metrics.
-
Alerting Capabilities: Grafana supports sophisticated alerting rules that notify you through email, Slack, PagerDuty, and other channels whenever certain thresholds are crossed.
-
Multi-Data Source Support: You can combine data from Prometheus, Elasticsearch, and other sources in a single dashboard for comprehensive insights.
-
Team Collaboration: Dashboards can be shared across teams, facilitating quicker troubleshooting and decision-making.
Deploying Grafana in Kubernetes
Deploying Grafana inside a Kubernetes cluster is straightforward, and there are multiple ways to do it:
1. Deploy Using Helm Chart (Recommended)
Helm is a package manager for Kubernetes that simplifies application deployment.
This command deploys Grafana with default settings. You can customize it by providing values via a YAML file.
2. Manual Deployment via Kubernetes Manifests
If you want granular control, you can create Kubernetes YAML manifests for Deployment, Service, ConfigMap, and Ingress resources.
Add Importing Pre-Built Kubernetes Dashboards
Grafana offers a vast library of community-contributed dashboards tailored for Kubernetes monitoring:
-
Go to Grafana Dashboards and search for Kubernetes.
-
Popular dashboard IDs:
-
Kubernetes Cluster Monitoring (ID: 6417)
-
Kubernetes Nodes (ID: 315)
-
Kubernetes Pods (ID: 7219)
-
Importing Dashboards
In Grafana:
-
Click the + icon on the left panel, then select Import.
-
Enter the dashboard ID and click Load.
-
Select your Prometheus data source and click Import.
Building Custom Dashboards in Grafana in kubernetes
While pre-built dashboards provide a quick start, building custom dashboards helps focus on metrics important to your applications.
Common Panel Types:
-
Graph: Time-series line charts to track metrics like CPU or memory usage over time.
-
Singlestat: Displays key numbers such as current CPU usage or number of active pods.
-
Heatmap: Visualizes density or distribution patterns in data.
-
Table: For tabular data representation.
-
Alert Panel: Defines conditions for triggering alerts based on metric values.
Using PromQL Queries
Grafana uses PromQL, Prometheus’s query language, to fetch specific metrics:
Example to get CPU usage for pods in the “default” namespace:
You can customize queries to fit your monitoring needs.
Best Practices for Grafana in kubernetes
-
Secure Your Grafana Instance:
-
Change default passwords immediately.
-
Enable authentication (LDAP, OAuth).
-
Restrict access using Kubernetes NetworkPolicies and TLS.
-
-
Organize Dashboards:
-
Avoid clutter by focusing dashboards on specific teams or functions.
-
Group related metrics together for easier analysis.
-
-
Optimize Data Collection:
-
Tune Prometheus scrape intervals to balance granularity and performance.
-
Limit high-cardinality labels to avoid performance bottlenecks.
-
-
Backup Dashboards and Configurations:
-
Export dashboards regularly and store them in version control systems.
-
-
Leverage Annotations:
-
Use annotations to mark deployments, incidents, or events on graphs for easier correlation.
-
-
Regularly Update Grafana and Plugins:
-
Stay updated to benefit from the latest features and security patches.
-
Challenges
While Grafana is powerful, some challenges include:
-
Learning Curve: New users may find PromQL and dashboard design challenging initially.
-
Resource Usage: Large dashboards with many queries can impact Grafana’s performance.
-
Security: Exposing Grafana dashboards without proper safeguards can lead to data exposure.
Scaling Grafana for Large Kubernetes Environments
In large clusters, monitoring data can be voluminous. Consider:
-
Horizontal Scaling: Run multiple Grafana replicas behind a load balancer.
-
Use Thanos or Cortex: For scalable, long-term Prometheus storage, which integrates with Grafana.
-
Optimize Dashboards: Reduce the number of queries and use efficient PromQL expressions.
Conclusion
Grafana is an indispensable tool in the Kubernetes monitoring ecosystem. Its ability to visualize complex metrics and support flexible alerting empowers DevOps teams to maintain healthy, performant Kubernetes clusters. By integrating Grafana with Prometheus and customizing dashboards, teams gain deep insights and proactive alerts, enabling efficient troubleshooting and resource management.
If you’re managing Kubernetes clusters, deploying Grafana and mastering its features should be a top priority to ensure smooth, reliable operations.
Setting up Prometheus in Kubernetes
know More about blog click here