Introduction
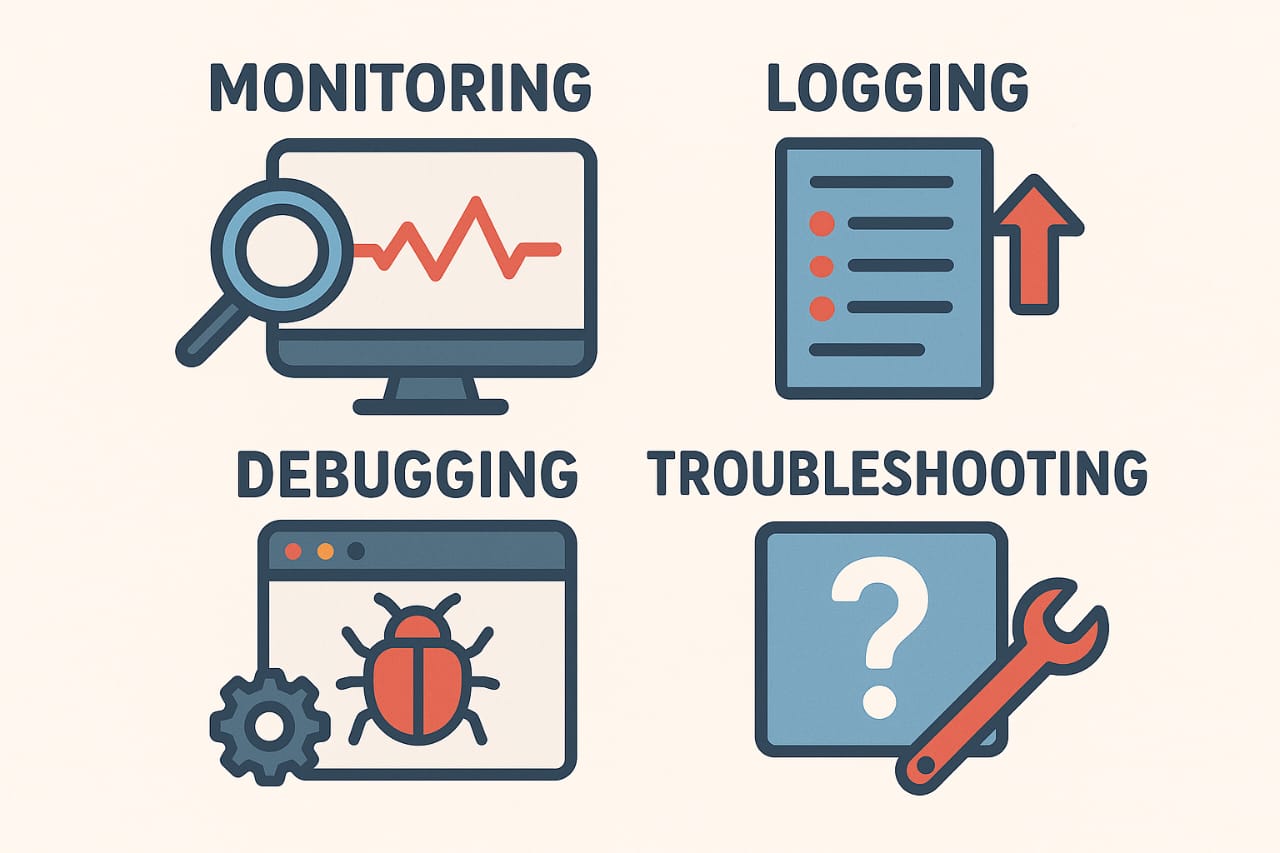
Monitoring, logging, debugging, and troubleshooting in Kubernetes are essential practices for ensuring that containerized applications run reliably, securely, and efficiently. K8s orchestrates thousands of workloads in dynamic environments, but without proper observability and Code Analysis workflows, problems can go unnoticed until they affect users. In this blog, we’ll cover how to set up collect logs, debug issues, and troubleshoot production problems in K8s clusters.
1. Monitoring in Kubernetes
It is the continuous collection, processing, and analysis of performance and health data from your cluster, nodes, and applications. It helps detect anomalies, plan scaling, and optimize resource usage.
Key Metrics to Monitor
-
Cluster health: Node readiness, CPU/memory pressure
-
Application performance: Response time, error rates
-
Resource usage: CPU, memory, storage, network
-
Pod lifecycle: Restarts, pending states
Popular Tools
-
Prometheus – Open-source metrics collection & alerting
-
Grafana – Visualization dashboards
-
Kube-State-Metrics – K8s object state metrics
-
Loki – Log aggregation (works with Grafana)
Example:
Best Practices:
-
Set up alerts for critical events
-
Use dashboards for real-time visual insights
-
Monitor custom metrics for business logic
2. Logging in Kubernetes
It is the process of recording events and application output for later review. In K8s, logs help you understand system and application behavior.
Types of Logs
-
Application logs: Generated by the app inside a container
-
Node logs: System logs from the host machine
-
Cluster component logs: From kube-apiserver, kubelet, controller-manager, etc.
Viewing Pod Logs:
To view logs for a specific container in a pod:
Centralized Solutions
-
ELK Stack (Elasticsearch, Logstash, Kibana)
-
Fluentd + Grafana Loki
-
OpenSearch Dashboards
Best Practices for:
-
Store logs centrally
-
Use structured Event Storage (JSON) for easy parsing
-
Set retention policies to manage storage
3. Debugging in Kubernetes
It is identifying and fixing errors in applications or K8s configurations.
Common Scenarios
-
Pod stuck in Crash Loop Back Off
-
Service not reachable
-
Containers failing health checks
-
Configuration errors in YAML manifests
Example:
This command provides detailed information about pod events, reasons for restarts, and container status.
Tools and Commands:
-
kubectl exec -it <pod-name> — /bin/sh → Access container shell
-
kubectl port-forward → Test service locally
-
kubectl get events –sort-by=.metadata.creationTimestamp → Check recent cluster events
Best Practices :
-
Always check events before modifying configs
-
Validate YAML manifests with
kubectl apply --dry-run=client -f file.yaml -
Use readiness/liveness probes for early issue detection
4. Troubleshooting in Kubernetes
It is the systematic process of diagnosing and resolving issues in K8s environments, often involving both Observation, data and logs.
Workflow
-
Identify the Problem – Use Observation alerts/log analysis
-
Gather Context – Check pod/node status, events, metrics
-
Form Hypotheses – Possible root causes
-
Test & Verify Fixes – Apply changes and recheck metrics/logs
-
Document & Prevent – Update playbooks and automation
Example:
Possible fixes:
-
Increase resource requests/limits
-
Fix missing Config Maps/Secrets
-
Correct invalid image references
5. Integrating the Four Pillars Together:
-
Observation detects anomalies
-
Event Storage provides context for those anomalies
-
Code Analysis drills down to find the root cause
-
Problem Resolution applies and validates the fix
Example Integration Stack:
-
Prometheus (metrics)
-
Grafana (dashboards)
-
Loki (logs)
-
Kubectl (Code Analysis/Problem Resolution)
6. Security and Reliability Considerations
When implementing Performance Checks, Event Storage, and Problem Resolution in K8s workflows:
-
Ensure logs do not leak sensitive information
-
Use RBAC to control access to Observation, and Event Storagetools
-
Enable audit Event Storage for K8s API calls
-
Backup Observation, dashboards and Event Storage configurations
7. Best Practices
Monitoring:
Use alerts for CPU, memory, and pod restarts
Monitor application-level metrics
Logging:
Centralize logs with ELK or Loki
Use structured logs
Debugging:
Use kubectl describe before making changes
Test YAML files with --dry-run
Troubleshooting:
Document recurring issues in a runbook
Automate fixes where possible
8. Conclusion
Monitoring, logging, debugging, and troubleshooting in Kubernetes form the backbone of a healthy and reliable cluster. Without them, teams operate in the dark, risking downtime and poor user experience. By implementing the right tools, workflows, and best practices, DevOps teams can proactively detect issues, diagnose problems quickly, and ensure seamless application performance.
For official guidelines, ] ps://www.devopsworld.co.in/#
You can also read click here
