Introduction
In Kubernetes, monitoring resource usage like CPU and memory is crucial for scaling applications and ensuring optimal performance. Metrics Server in Kubernetes is a lightweight, scalable tool that collects resource usage metrics from the Kubernetes API and makes them available for the cluster. It’s an essential component for features like Horizontal Pod Autoscaler (HPA) and Vertical Pod Autoscaler (VPA).
The Metrics Server in Kubernetes replaces older tools like Heapster and is now the recommended way to gather resource metrics at the cluster level.
What is Metrics Server
The Metrics Server is a cluster-wide aggregator of resource usage data. It gathers metrics from the kubelet on each node through the Summary API and stores them in memory (not in a long-term database).
This means Metrics Server is designed for real-time, short-term metrics — not historical data storage. If you need long-term monitoring, you can integrate tools like Prometheus.
Key Features
Here are some of the major features:
-
Lightweight – Minimal resource usage.
-
Scalable – Works efficiently even in large clusters.
-
Cluster-wide – Gathers data from all nodes and pods.
-
API-driven – Accessible via Kubernetes Metrics API.
-
Autoscaling Support – Required for HPA and VPA.
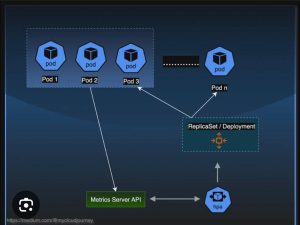
How Metrics Server Works
-
Kubelet Collection – Each node’s kubelet exposes CPU and memory usage via the Summary API.
-
Metrics Server Aggregation – Metrics Server queries all nodes for their usage data.
-
Kubernetes API Exposure – Data is made available via the Kubernetes Metrics API.
-
Autoscaler Usage – HPA and VPA query the Metrics API for scaling decisions.
Installing Metrics Server in Kubernetes
The Metrics Server is not installed by default in most Kubernetes clusters. To install it:
Verify Installation
You should see the Metrics Server deployment running.
Checking Metrics with Metrics Server
Once installed, you can run:
Example output:
Common Use Cases of Metrics server
-
Horizontal Pod Autoscaler (HPA)
The HPA uses metrics from the Metrics Server to scale pods based on CPU/memory usage.Example:
-
Monitoring Cluster Health
You can quickly check which nodes or pods are consuming high resources. -
Capacity Planning
Helps you understand workload patterns.
Troubleshooting Metrics Server in Kubernetes
If kubectl top returns an error like:
Possible fixes:
-
Ensure the Metrics Server is installed correctly.
-
Check logs:
-
Make sure your cluster network allows communication between Metrics Server and kubelets.
Benefits
-
Lightweight and Fast – Unlike full-fledged monitoring tools, the Metrics Server is designed for minimal resource consumption.
-
Seamless Autoscaling – Works perfectly with Horizontal Pod Autoscaler (HPA) and Vertical Pod Autoscaler (VPA) to adjust workloads automatically based on CPU and memory usage.
-
No Persistent Storage Needed – Stores metrics only in memory, which makes it highly efficient.
-
Easy Deployment – Can be installed in just a few commands using official Kubernetes manifests or Helm charts.
-
Cluster-Wide Visibility – Collects metrics from all nodes and pods, providing a unified view of cluster health.
-
Best Practices for Metrics Server in Kubernetes
-
Always run the latest stable release.
-
Limit resource requests/limits to prevent overload.
-
Use Prometheus for long-term metric storage.
-
Enable RBAC rules properly for Metrics Server.
-
Secure Metrics Server communication with TLS.
Conclusion
The Metrics Server in Kubernetes is an essential tool for resource monitoring and autoscaling. It’s lightweight, fast, and perfect for real-time metrics — but not a replacement for full-fledged monitoring systems like Prometheus.The Kubernetes is the backbone of real-time resource monitoring in a cluster. It enables features like autoscaling, quick performance checks, and efficient capacity planning without adding heavy overhead.
By installing and configuring it correctly, you can make informed scaling decisions, monitor performance, and keep your Kubernetes workloads running smoothly.While it’s perfect for short-term metric collection, pairing it with tools like Prometheus ensures both real-time and historical insights, helping you keep your Kubernetes workloads healthy and scalable.
For advanced usage examples, click here