
Introduction
In today’s IT-driven world, monitoring systems are crucial. Nagios is one of the most reliable and widely used open-source monitoring tools that helps businesses keep track of their servers, networks, and applications. This guide explains the features, advantages, and reasons why many organizations prefer this monitoring solution.
What is Nagios?
Nagios is an open-source monitoring system designed to detect problems in IT infrastructure before they affect business processes. The software provides alerts and performance data, making it easier for administrators to manage networks effectively.

uses:
-
It tells you if something goes wrong (like a website goes down or your system is slow).
-
It can send alerts (emails, messages) to let you know there’s a problem.
- It helps in avoiding downtime by warning you early.
Key Features :
-
Server Monitoring – Tracks CPU usage, disk space, memory, and processes.
-
Network Monitoring – Detects downtime in routers, switches, and firewalls.
-
Application Monitoring – Ensures that applications are running smoothly.
-
Alert System – Sends notifications via email, SMS, or other integrations.
-
Scalability – The software supports small businesses as well as large enterprises.
What can Nagios monitor?
-
Whether a server is running
-
If a website is online
-
Disk space on a computer
-
CPU or memory usage
-
Network traffic
Components:
-
Monitoring tool Core – The main engine that does the monitoring.
-
Plugins – Small programs that check specific services or devices.
-
Web Interface – A webpage where you can see everything (status, alerts, etc.).
-
Configuration Files – You write in these to tell monitoring tool what to check and how.
How does work?
The monitoring tool uses plugins to collect data from hosts and services. This data is then processed and displayed in dashboards. If performance drops or an error occurs, Monitoring toll immediately sends alerts to administrators.
Example:
-
Ping your website every few minutes.
-
If the website is down, it will:
-
Show a red alert on the dashboard.
-
Send you an email or SMS.
-
Benefits:
-
Proactive Monitoring: Identify issues before they impact users.
-
Flexibility: Supports multiple plugins and add-ons.
-
Open-Source Advantage: Free to use with a strong community base.
-
Customizable Dashboards: Easy-to-read reports and visualization
Use Cases:
-
IT Infrastructure Monitoring
-
Cloud and Hybrid Environment Monitoring
-
Database and Application Monitoring
-
Security and Log Management
2. Nagios Installation (on Linux – usually Ubuntu or CentOS)
It runs best on Linux systems.
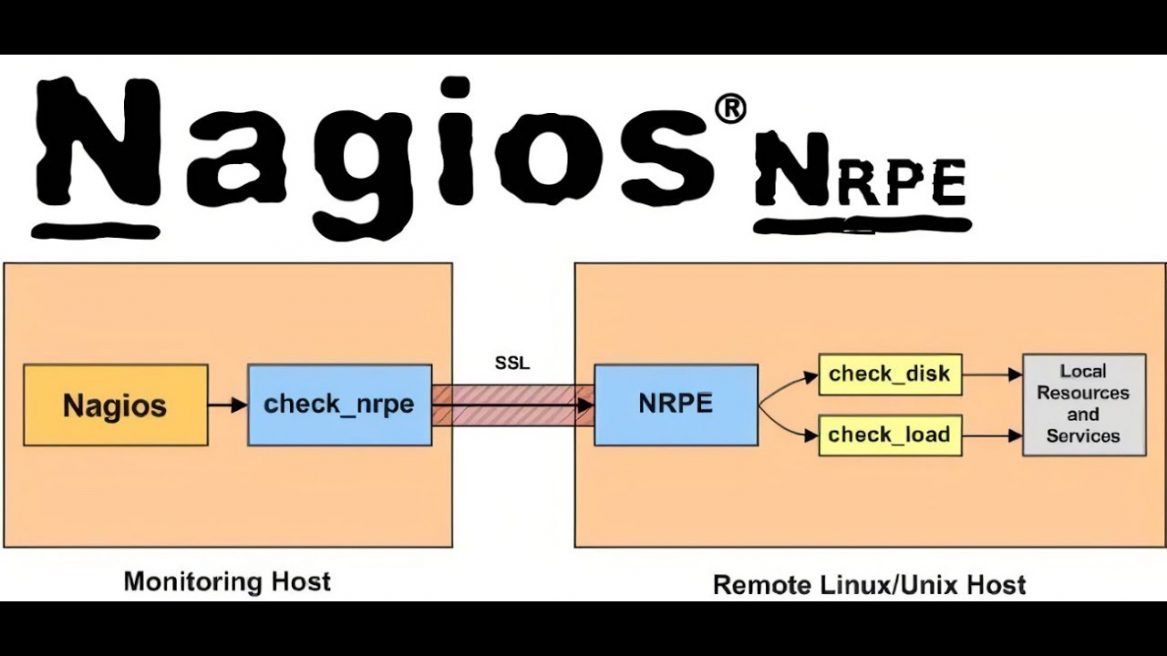
3. NRPE (Nagios Remote Plugin Executor)
What is NRPE?
NRPE allows Nagios to monitor other computers remotely.
For example, if you want to monitor another system’s:
-
CPU usage
-
Disk space
-
Running services
You use NRPE on that remote system.
NRPE Installation Steps
Step 1: Update Your System
(For RHEL/CentOS: sudo yum update -y)
Step 2: Install NRPE and the software Plugins
On Ubuntu/Debian
On CentOS/RHEL
First enable EPEL:
Then install:
Step 3: Configure NRPE
Edit NRPE config file:
Make changes:
-
Allow the software server IP
-
Define Commands (like check_load, check_disk, check_users)
Example:
Save and exit.
Step 4: Start and Enable NRPE Service
Step 5: Verify NRPE from the software Server
On the the software server, test connectivity:
If it works, you’ll get a response like:
Step 6: Add Remote Host in the software Server Configuration
On the software server edit host config:
Example:
define service {
use generic-service
host_name remotehost
service_description CPU Load
check_command check_nrpe!check_load
}
Save and restart the software:
sudo systemctl restart the software
Conclusion
Nagios remains one of the most trusted open-source monitoring systems. Its reliability, flexibility, and active community make it a strong choice for organizations of all sizes. By implementing the monitoring tool, businesses can ensure stable, secure, and efficient IT operations.
Official Nagios: https://www.nagios.org/